Ecommerce Conversion Rate: Formula, Calculation and Shopify

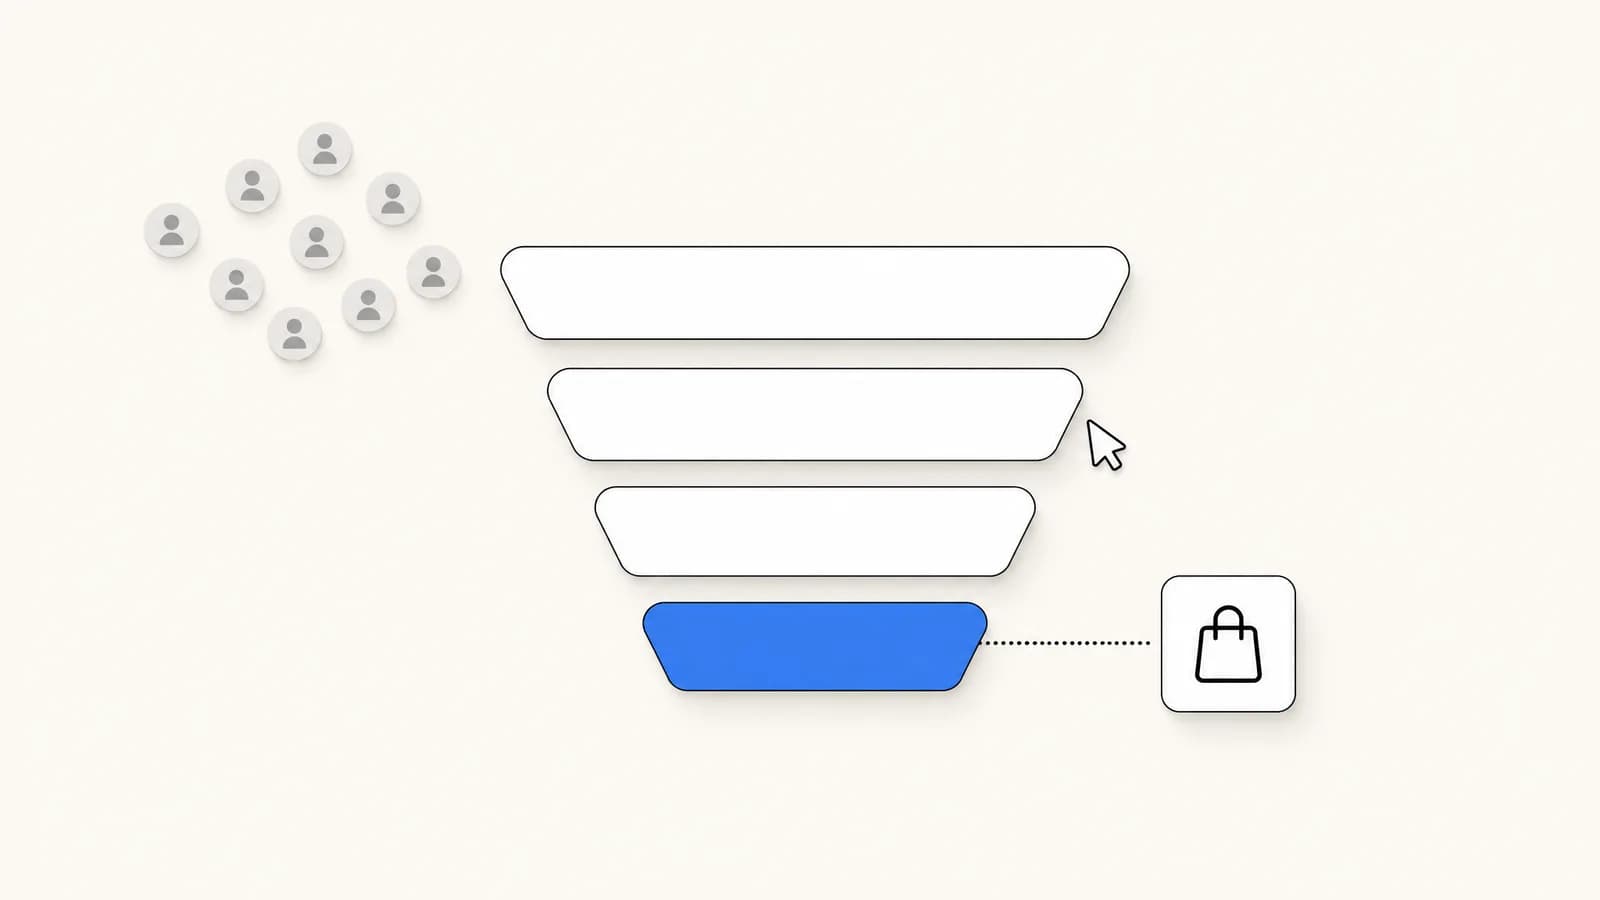
Ecommerce conversion rate explained: the formula, a worked example, the variants, how Shopify calculates it and where to find it, common mistakes and levers.
Table of contents (13)
An ecommerce conversion rate is the share of visits to an online store that end in a purchase: conversion rate = sessions with a purchase ÷ total sessions × 100. Shopify uses that session-based definition, with the formula "sessions that completed checkout / sessions" (Shopify Help Center, as of October 7, 2026).
This guide writes out the formula, works through a fictional example, compares the variants and what each measures, shows where to read the rate in Shopify and what changed in its measurement in September 2026, then covers the usual mistakes and the levers you control. It quotes no "average conversion rate": such figures depend on how sessions are counted, and a rate without its method cannot be compared with yours.
What is an ecommerce conversion rate?
It measures how well a store turns visits into orders. Three terms need a definition before the formula means anything:
- Session: a visit. On Shopify, a session ends after 30 minutes of inactivity, and the same visitor can have several sessions.
- Visitor: a person, or more exactly a device. Shopify's example: one person visiting 5 times counts as 1 visitor but 5 sessions.
- Conversion: here, a completed purchase. Other conversions exist (a signup, an add to cart), and they have their own rates.
What is the conversion rate formula?
Conversion rate = sessions that completed checkout ÷ total sessions × 100
The same logic gives a rate for each step before the purchase. Shopify's analytics fields reference defines three of them:
| Metric in Shopify | Formula given by Shopify |
|---|---|
| Added to cart rate | Sessions with cart additions ÷ sessions |
| Reached checkout rate | Sessions that reached checkout ÷ sessions |
| Conversion rate | Sessions that completed checkout ÷ sessions |
Source: Shopify Help Center, as of October 7, 2026.
How do you calculate it? A worked example
The store and the figures below are fictional. They show the arithmetic.
Over one month, a store records:
| Step | Sessions |
|---|---|
| All sessions | 40,000 |
| Sessions with cart additions | 3,200 |
| Sessions that reached checkout | 1,600 |
| Sessions that completed checkout | 1,000 |
Rates over total sessions:
- Added to cart rate = 3,200 ÷ 40,000 × 100 = 8%
- Reached checkout rate = 1,600 ÷ 40,000 × 100 = 4%
- Conversion rate = 1,000 ÷ 40,000 × 100 = 2.5%
Rates from one step to the next:
- Cart to checkout = 1,600 ÷ 3,200 × 100 = 50%
- Checkout to purchase = 1,000 ÷ 1,600 × 100 = 62.5%
The two readings complement each other. The first tells you where the store stands overall. The second tells you where sessions are lost: in this example, half of the carts never reach checkout, and 600 of the 1,600 checkouts started are not completed.
What the rate is worth in revenue
Conversion rate links traffic to sales:
Revenue = sessions × conversion rate × average order value
With an average order value of $60 (fictional): 40,000 × 2.5% × $60 = $60,000.
If the rate moved from 2.5% to 2.75%, with the same traffic and the same order value: 40,000 × 2.75% × $60 = $66,000. A quarter of a point is worth $6,000 a month in this example. The same formula shows why conversion rate cannot be read alone: our guide to average order value covers the third term.
Which variants of the formula exist?
| Variant | Formula | What it measures |
|---|---|---|
| Session-based | Sessions with a purchase ÷ sessions | How often a visit ends in an order (Shopify's definition) |
| Visitor-based | Orders ÷ unique visitors | How many people end up buying over a period |
| Order-based | Orders ÷ sessions | Orders per visit, counting several orders in one session |
| Checkout conversion | Completed checkouts ÷ checkouts reached | How well the checkout itself performs |
| Step rates | Sessions at a step ÷ sessions | Where the funnel loses sessions |
| Segment rates | The same formula, on one channel, device or landing page | Which traffic converts |
The variants give different numbers on the same store. Continuing the fictional example, with 25,000 unique visitors and 1,050 orders:
- Session-based: 1,000 ÷ 40,000 = 2.5%
- Visitor-based: 1,050 ÷ 25,000 = 4.2%
- Order-based: 1,050 ÷ 40,000 = 2.625%
All three are correct. They answer different questions, and this is the first reason two tools, or two stores, rarely agree. Shopify itself points out one of the gaps: a customer can make several purchases during a single session, so the order count and the count of sessions that completed checkout "might not be the same" (Help Center).
Where do you find your conversion rate in Shopify?
Shopify documents three places, all in the behavior reports and the Analytics dashboard.
The Analytics dashboard
Go to Analytics in your Shopify admin. The dashboard displays your session metrics, conversion rate included, on metric cards. Clicking the title of a card opens the matching report. If you don't use the Online Store channel, the metrics related to online store sessions aren't displayed.
Conversion rate over time
- From your Shopify admin, go to Analytics > Reports.
- Click the Category filter, then Behavior.
- Open Conversion rate over time.
- Use Group by to display the rate by day, week or month.
The report has six columns: the time grouping, Sessions, Sessions with cart additions, Sessions that reached checkout, Sessions that completed checkout and Conversion rate. Shopify defines "reached checkout" as sessions where there was user input during checkout, for example a key press or mouse click.
Conversion rate breakdown
This report shows the path as a funnel, in this order: All sessions, Sessions with cart additions, Sessions that reached checkout, Sessions that completed checkout. An Open Funnel toggle switches between two readings:
| Funnel type | What it includes |
|---|---|
| Open | Sessions that enter at any step, in any sequence. A visitor who reaches checkout without adding to cart counts in Reached checkout |
| Closed | Only sessions that complete all steps in order: add to cart, then checkout, then purchase |
Source: Shopify Help Center, as of October 7, 2026.
Shopify notes that the rate for each step is the number of sessions for that step divided by total sessions. The list of behavior reports also includes a Checkout conversion rate report and a Conversion rate (online store) report.
You can also ask Sidekick, Shopify's assistant. The Help Center suggests a prompt such as "Show my conversion rate by device type for the last 30 days".
What does Shopify count, and what changed in September 2026?
Since the rate is a ratio, everything depends on how sessions are counted. Four points from Shopify's documentation.
Cookie consent. In the fields reference, Shopify states that sessions are "only counted when visitors consent to cookies through your cookie banner", and that other analytics platforms calculate sessions differently. A store with a consent banner can therefore count fewer sessions than it receives visits.
The online store only. The definition refers to online store visits. Orders from other channels are not part of this rate.
The session measurement update. Shopify rolled out a change from September 21 to 23, 2026, described on a dedicated page:
| Before | After the update |
|---|---|
| A session ended at midnight UTC | Sessions are based on continued activity, and end after 30 minutes of inactivity |
| Sessions needed a pageview | Some sessions without a pageview are counted, such as going straight to checkout from a cart link |
| Bot sessions could appear in reports | Identified bot sessions are filtered out of session-related reports by default |
Shopify spells out the effect: "A higher or lower conversion rate after this update isn't automatically good or bad." Fewer sessions (bots removed) raise the rate. More sessions (visits without a pageview) lower it. Orders, sales and customer counts aren't affected. Its advice is to use data from after the update as a new baseline.
Comparisons across the update. Historical data isn't deleted or reprocessed, but bot classification applies only to sessions from October 7, 2025 and after. A year-over-year comparison that straddles these dates mixes two measurement methods. Shopify recommends using the same Human or bot session filter setting on both periods, in reports that support it, and reviewing orders and sales alongside sessions.
What are the common mistakes when reading a conversion rate?
Comparing rates built on different definitions. A session-based rate from Shopify and a visitor-based rate from another tool are two metrics. Before comparing, check the numerator, the denominator and the scope.
Comparing with an "industry average". A published average blends stores, countries, devices and tracking setups. Without its method, you cannot tell whether your rate is above or below it. Your own history is the comparison that holds.
Reading the rate without the traffic mix. A campaign that brings many first-time visitors lowers the rate without anything being wrong on the site. Returning customers and email clicks convert differently from cold ad traffic. Segment by channel before you conclude.
Ignoring the device split. A store can have a stable rate on each device and a falling overall rate, simply because the share of mobile sessions grew. Look at each device separately.
Drawing conclusions from small numbers. With 300 sessions and 6 purchases, the rate is 2%. One purchase more or less moves it to 2.33% or 1.67%. On small volumes, look at longer periods.
Optimizing the rate against revenue. A deep discount can raise conversion rate and lower margin. A price increase can lower the rate and raise profit. The target is what the three terms produce together: sessions × conversion rate × average order value, then margin.
Forgetting what happens after. Conversion rate stops at the order. Returns, refunds and repeat purchases are not in it. Our guide to customer lifetime value covers what happens after the first order.
Mixing periods across a measurement change. As Shopify notes for its September 2026 update, a change in method changes the rate without any change in behavior.
Which levers does a merchant control?
The funnel shows where to act. Each step has its own causes.
| Step | What to look at |
|---|---|
| Sessions to cart | Traffic quality, product pages, price display, reviews, site speed |
| Cart to checkout | Shipping cost and delivery time shown early, cart clarity, payment options visible |
| Checkout to purchase | Unexpected costs, form length, payment methods, trust signals |
| After abandonment | Recovery messages, reminders, customer service availability |
A few of these are documented by Shopify itself.
Shipping. Shopify's shipping strategy page states that free shipping usually has a positive impact on cart conversion, and that carrier-calculated rates, which can't be displayed before checkout, might lead to more abandoned checkouts. Our guide to Shopify shipping rates explains the options.
Speed. In its behavior reports documentation, Shopify writes that optimizing web performance can improve the shopping experience and increase conversion, and it measures performance through 3 Core Web Vitals.
Answers at the moment of doubt. A question about size, delivery or returns that goes unanswered ends the session. A chat on the storefront, such as Shopify Inbox, or a messaging channel the customer already uses, keeps the conversation going.
Abandoned checkouts. In the fictional example, 600 checkouts were started and not completed. Recovering part of them raises orders without any extra traffic. Shopify includes abandoned checkout emails, and apps add other channels. Kanal, a WhatsApp marketing and sales app for Shopify stores, handles abandoned cart recovery on WhatsApp. Our guide to abandoned cart recovery strategies compares the approaches.
Traffic quality. The rate has a denominator. Paying for sessions that have no intent to buy lowers the rate and the return on ad spend at the same time. Our guide to ROAS covers that side.
Whatever you change, change one thing at a time and compare equal periods, by device and by channel, so you can attribute the difference to what you did.
Ecommerce conversion rate in short
- Formula: sessions that completed checkout ÷ sessions × 100.
- Variants: session-based, visitor-based, order-based, checkout conversion. Same store, different numbers.
- In Shopify: Analytics dashboard, Conversion rate over time and Conversion rate breakdown under Analytics > Reports > Behavior.
- Measurement: sessions depend on cookie consent, bot filtering and session rules. Shopify changed these on September 21 to 23, 2026.
- Comparison: your own rate over time, by channel and device, with the same definition.
- Reading: always next to traffic, average order value and margin.
Frequently asked questions
What is an ecommerce conversion rate?
It is the share of visits to an online store that end in a purchase. The usual formula is conversion rate = sessions with a purchase ÷ total sessions × 100. A store with 40,000 sessions and 1,000 sessions that completed checkout has a conversion rate of 2.5%. Some tools divide orders by visitors instead, which gives a different figure.
How does Shopify calculate conversion rate?
Shopify's analytics reference defines conversion rate as the percentage of online store visits (sessions) that resulted in a sale, with the formula sessions that completed checkout ÷ sessions. It is a session-based rate for the online store, and Shopify notes that other analytics platforms calculate sessions differently.
Where do I find my conversion rate in Shopify?
From your Shopify admin, go to Analytics, then Reports, and filter the Category on Behavior. The Conversion rate over time report shows sessions, cart additions, checkouts and the rate by day, week or month. The Conversion rate breakdown report displays the same steps as a funnel. The Analytics dashboard also has a conversion rate card.
Why did my Shopify conversion rate change in September 2026?
Shopify rolled out a session measurement update from September 21 to 23, 2026. Sessions no longer end at midnight UTC, some sessions without a pageview are now counted, and identified bot sessions are filtered out by default. Since conversion rate is calculated from sessions, it can change even when orders and sales did not.
What is a good ecommerce conversion rate?
There is no single figure that applies to every store. The rate depends on the product, the price, the traffic mix, the device and the way sessions are counted. A published average rarely states its method, so it is hard to compare with yours. The reliable comparison is your own rate over time, by channel and by device.

Nicolas helps e-commerce brands grow revenue with WhatsApp marketing. With deep expertise in Shopify ecosystems and conversational commerce, he shares proven strategies for abandoned cart recovery, broadcast campaigns, and AI-powered customer engagement.
Ready to boost your WhatsApp sales?
 Install with Shopify
Suggested articles
Customer Lifetime Value: Formula, Calculation and Examples
Customer lifetime value formula explained: how to calculate CLV, a worked example, the main variants, where to find it in Shopify and common mistakes.
Shopify Shipping Rates: Types, Setup and Plan Requirements
Shopify shipping rates explained: flat, order amount, weight, free and carrier-calculated rates, local delivery, pickup, setup steps and plan rules.

Yotpo Pricing in 2026: Reviews Plans and Order Tiers
Yotpo pricing explained: free plan limits, Starter and Pro prices by monthly orders, Reviews Booster overage, annual billing, Loyalty and bundle prices.

Why are my texts green? iMessage vs SMS vs RCS (2026)
Green texts on iPhone were sent as SMS, MMS or RCS instead of iMessage. What blue and green mean, what Sent as Text Message means, and how to get blue back.