Customer Lifetime Value: Formula, Calculation and Examples

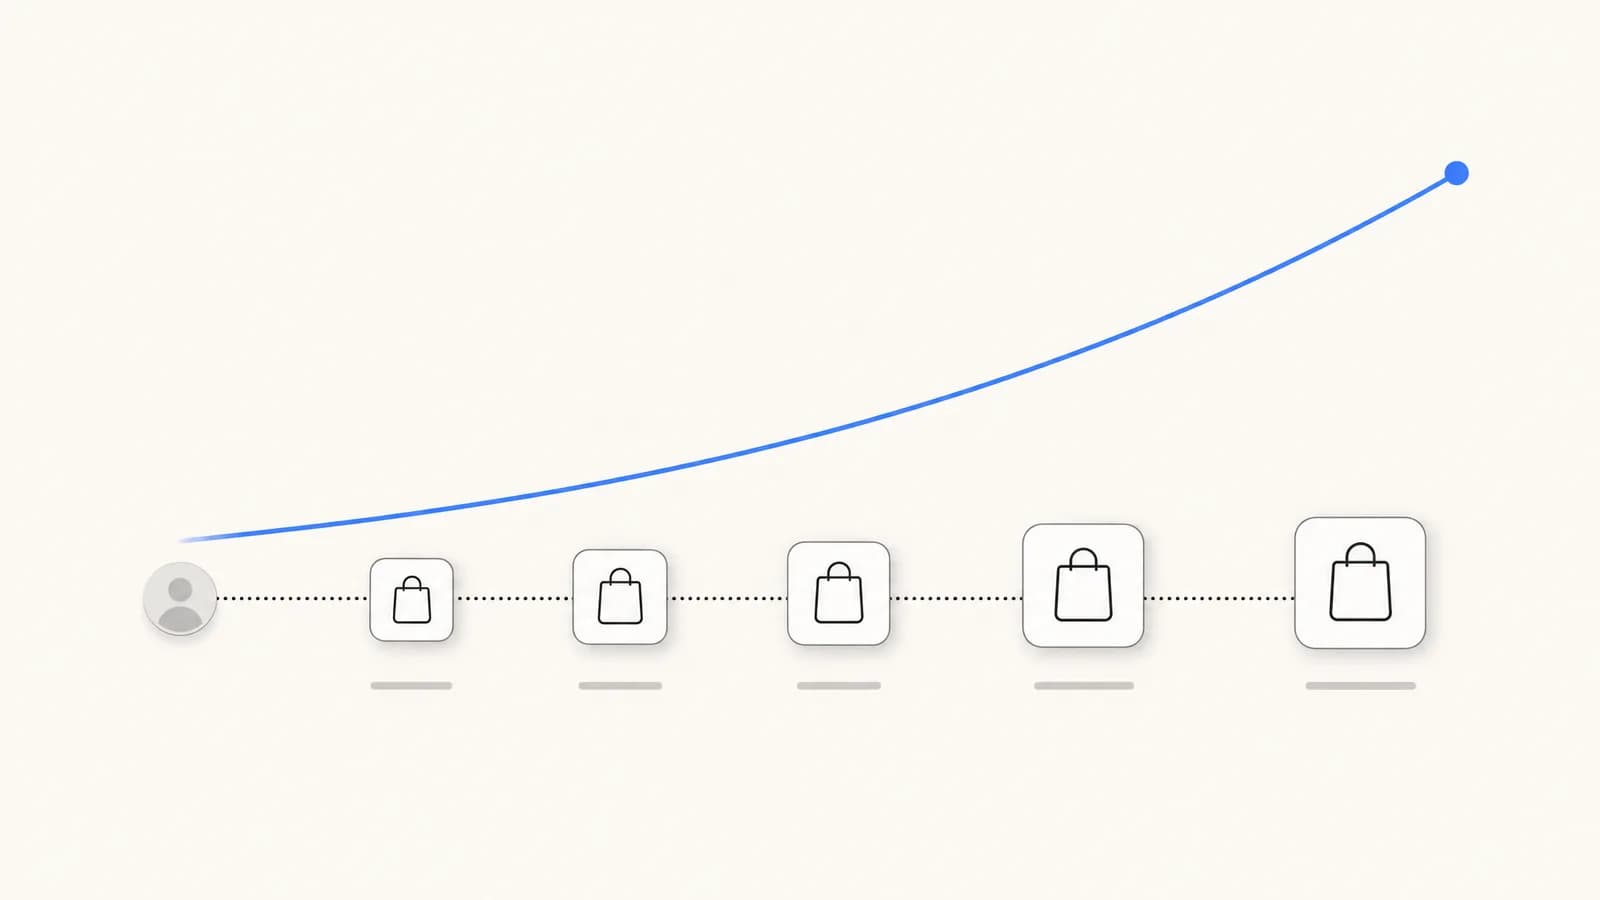
Customer lifetime value formula explained: how to calculate CLV, a worked example, the main variants, where to find it in Shopify and common mistakes.
Table of contents (15)
Customer lifetime value (CLV) is the total amount a customer brings to your business over the whole relationship. The basic formula is CLV = average order value × purchase frequency × customer lifespan, and you multiply the result by your gross margin to express it in profit instead of revenue.
This guide writes out the formula, works through a fictional example with the arithmetic shown, compares the main variants and what each one measures, and shows where the figure sits in Shopify analytics according to the Shopify Help Center, read on October 7, 2026. It then covers the usual calculation mistakes and the levers you control. It gives no "good CLV" benchmark: the figure depends on what you sell and how you compute it, and a number without its method cannot be compared with yours.
What is customer lifetime value?
Customer lifetime value answers one question: what is a customer worth to the business, from the first order to the last?
It is a per-customer metric measured over time, which sets it apart from the figures you read daily:
| Metric | Unit | Time frame | Question it answers |
|---|---|---|---|
| Average order value | Per order | A period | How much is a typical order? |
| Conversion rate | Per session | A period | What share of visits end in a purchase? |
| Customer lifetime value | Per customer | The whole relationship | What does a customer bring in over time? |
CLV and LTV (lifetime value) refer to the same idea in e-commerce. You will also see CLTV. The abbreviation matters less than the definition behind the number.
What is the customer lifetime value formula?
The basic formula has three inputs:
CLV = average order value × purchase frequency × customer lifespan
- Average order value (AOV) = revenue ÷ number of orders, over a period. Our guide to average order value covers its variants.
- Purchase frequency = number of orders ÷ number of unique customers, over the same period (usually a year).
- Customer lifespan = the number of years a customer keeps buying from you.
The first two multiply into a useful intermediate figure, the annual customer value:
Customer value per year = average order value × purchase frequency
And the profit-based version adds one factor:
CLV in profit = average order value × purchase frequency × customer lifespan × gross margin
How do you calculate customer lifetime value? A worked example
The store and the figures below are fictional. They are here to show the arithmetic.
A skincare store looks at its last 12 months:
| Input | Value |
|---|---|
| Revenue | $240,000 |
| Orders | 4,000 |
| Unique customers | 2,500 |
| Estimated customer lifespan | 3 years |
| Gross margin | 60% |
Step by step:
- Average order value = $240,000 ÷ 4,000 = $60
- Purchase frequency = 4,000 ÷ 2,500 = 1.6 orders per customer per year
- Customer value per year = $60 × 1.6 = $96
- CLV in revenue = $96 × 3 = $288
- CLV in profit = $288 × 0.60 = $172.80
So in this example a customer brings $288 in revenue over three years, of which $172.80 is gross profit. If the store spends $40 to acquire a customer, it has $172.80 - $40 = $132.80 left per customer to cover its other costs and its profit.
To run the same calculation on your own figures, use our customer lifetime value calculator.
Where does the lifespan come from?
It is the weakest input, because you are estimating the future. Two common ways to obtain it:
- From observation. Look at customers acquired several years ago and measure how long they kept ordering.
- From churn. If you know the share of customers who stop buying each year (the churn rate), lifespan = 1 ÷ churn rate. With a fictional churn rate of 40% a year, lifespan = 1 ÷ 0.40 = 2.5 years.
A young store has no long history. In that case, a CLV limited to a fixed horizon (12 or 24 months) is more honest than a lifetime figure built on a guess.
Which variants of the formula exist, and what does each measure?
| Variant | Formula | What it measures | When to use it |
|---|---|---|---|
| Simple CLV (revenue) | AOV × purchase frequency × lifespan | Revenue expected from a typical customer | A first order of magnitude |
| CLV in profit | Simple CLV × gross margin | Gross profit expected from a typical customer | Comparing with acquisition cost |
| Historical CLV | Sum of everything a customer has actually spent | Past value, with no forecast | Ranking existing customers |
| Cohort CLV | Cumulative spend of a cohort ÷ customers in the cohort, at a given age | Value reached after N months by customers acquired together | Tracking whether newer customers are worth more or less |
| Churn-based CLV | (AOV × purchase frequency × gross margin) ÷ churn rate | Same as CLV in profit, with lifespan derived from churn | Subscription and replenishment products |
| Net CLV | CLV in profit - customer acquisition cost | What a customer leaves after being acquired | Deciding acquisition budgets |
Three remarks on this table.
Historical and cohort versions use no assumption. They add up what happened. Their weakness is that recent customers have had less time to buy, so their value looks lower until they age.
Predictive versions depend on their inputs. The simple formula assumes every customer orders at the average rate for the whole lifespan. Reality is rarely that even: some customers buy once, others come back often.
Net CLV needs a clean acquisition cost. Customer acquisition cost is marketing spend ÷ new customers acquired, over the same period. Our CPA calculator and our guide to ROAS cover the acquisition side.
The same store, by cohort
Still fictional. The store groups the 200 customers who placed their first order in January and adds up what they spent over time:
| Age of the cohort | Cumulative spend of the cohort | Customers in the cohort | Cohort CLV |
|---|---|---|---|
| Month 0 | $11,000 | 200 | $11,000 ÷ 200 = $55 |
| Month 3 | $14,000 | 200 | $14,000 ÷ 200 = $70 |
| Month 6 | $16,400 | 200 | $16,400 ÷ 200 = $82 |
| Month 12 | $19,600 | 200 | $19,600 ÷ 200 = $98 |
The 12-month value here ($98) is close to the annual customer value of the simple formula ($96), which is expected: both describe one year. The cohort view adds the shape of the curve. In this example, more than half of the first-year value ($55 of $98) arrives with the first order, so the remaining $43 depends entirely on repeat purchases.
Where do you find customer lifetime value in Shopify?
Shopify's analytics don't list a metric named "customer lifetime value" in the analytics fields reference we read on October 7, 2026. The idea appears under other names.
Amount spent per customer, in the Customer cohort analysis
The fields reference defines Amount spent per customer as the "average cumulative amount customers in the given cohort have spent at your store". That is a cohort CLV in revenue.
To open the report (Shopify Help Center):
- From your Shopify admin, go to Analytics > Reports.
- Click the Category filter.
- Click Customers, then open Customer cohort analysis.
- In the configuration panel, use the Metric menu to select Amount spent per customer.
By default, customers are grouped into cohorts by the date of their first order, and each row is a cohort. The columns show the selected metric over the weeks, months or quarters since that first order. Clicking a cell opens the details of the cohort, including its average order value, the average number of orders per customer and the amount spent per customer.
Projections
With Amount spent per customer selected, a Show projections toggle displays predictions for future months. Shopify explains that they are based on your store's data over the previous 24 months for each cohort, and that the toggle isn't displayed if 24 months of data aren't available. It adds a caution: projections aren't a guarantee of future sales.
Predicted spend tier
Shopify also sorts customers into three tiers of expected future spending: High, Medium and Low. According to the Help Center, the prediction looks at how often a customer bought, how much they spent per order compared with the overall average, how many orders they placed and how recently. Your store must have made over 100 sales to use it. The tier works as a segment filter, for example predicted_spend_tier = 'HIGH'.
Other customer reports
- Returning customers lists each customer with two or more orders, with the number of orders, the average amount per order and the total amount spent. Shopify specifies that this total includes taxes, discounts, shipping and any refunds: it is a historical CLV per customer.
- Returning customer rate is defined in the fields reference as returning customers ÷ customers.
- RFM customer analysis groups customers by recency, frequency and monetary value.
Why Shopify's figure differs from yours
- Revenue, not profit. The reports work on amounts spent. Margin is yours to apply.
- Scope of the amount. The total spent in the Returning customers report includes taxes and shipping. A CLV built on product revenue alone will be lower.
- Recent data. Shopify notes that customer reports might not display all activity from the past 12 hours.
- Whole history. Customer reports are based on the entire order history of the customers in the report, not only on the orders of the selected period.
What are the common mistakes when calculating CLV?
Comparing revenue with a cost. A revenue-based CLV of $288 does not mean you can spend up to $288 to acquire a customer. Acquisition is paid out of margin. Compare CLV in profit with acquisition cost.
Mixing periods. AOV and purchase frequency must come from the same period and the same set of orders. An AOV from the holiday quarter multiplied by a frequency from the full year describes a customer who does not exist.
Counting orders instead of customers. Purchase frequency divides orders by unique customers. If guest checkouts create several customer records for one person, frequency is understated and so is CLV.
Inventing the lifespan. A lifespan of "5 years" for a store that opened 18 months ago is a hope. Prefer a horizon you can observe.
Using one average for everyone. Customers acquired through a discount and customers acquired at full price rarely behave the same way. A single average hides the difference. Cohorts by acquisition month, channel or first product show it.
Ignoring refunds and returns. Revenue that was refunded did not stay. Decide whether your inputs are before or after refunds, and keep the same choice everywhere.
Reading recent cohorts as weak. A cohort that is three months old cannot have a 12-month value yet. Compare cohorts at the same age.
Treating the formula as a forecast. The simple formula is a multiplication of averages. It tells you an order of magnitude, and it should be checked against what cohorts actually do.
How do you increase customer lifetime value?
The formula shows where the levers are: each input can move.
| Input | Lever | Examples |
|---|---|---|
| Average order value | Bigger baskets | Bundles, cross-sells, a free shipping threshold |
| Purchase frequency | More orders per year | Replenishment reminders, back-in-stock alerts, new product announcements |
| Customer lifespan | A longer relationship | Loyalty programs, service quality, subscriptions |
| Gross margin | More profit per order | Pricing, product mix, shipping and return costs |
A few points on each.
Second order first. In the cohort example above, the value added after the first order is what separates a $55 customer from a $98 one. The period right after a first purchase is where a second order is won or lost, which is why post-purchase messages matter. Our WhatsApp post-purchase playbook lists the messages stores send at that stage.
Offers after purchase. An offer made once the order is confirmed adds revenue without touching the checkout. Kanal, a WhatsApp marketing and sales app for Shopify stores, sends this kind of offer on WhatsApp with its post-purchase upsell feature.
Loyalty. Points, tiers and VIP perks give customers a reason to come back. Our comparison of loyalty apps for Shopify covers the tools.
Segments. Shopify's predicted spend tiers and RFM groups let you treat high-value customers differently from one-time buyers, instead of sending everyone the same message.
Margin. A higher CLV in revenue obtained through heavier discounts can lower CLV in profit. Check both figures after each change.
Customer lifetime value in short
- Formula: CLV = average order value × purchase frequency × customer lifespan. Multiply by gross margin for a profit-based value.
- Inputs: take AOV and frequency from the same period, and count unique customers.
- Variants: historical and cohort versions describe what happened. Predictive versions depend on the lifespan you assume.
- In Shopify: look for Amount spent per customer in the Customer cohort analysis report, and for predicted spend tiers in customer segments.
- Comparison: set CLV in profit, not in revenue, against what a customer costs to acquire.
- Levers: order value, frequency, lifespan and margin.
Frequently asked questions
What is the customer lifetime value formula?
The basic formula is customer lifetime value = average order value × purchase frequency × customer lifespan. Purchase frequency is the number of orders per customer per year, and lifespan is the number of years a customer keeps buying. Multiply the result by your gross margin to get a value in profit instead of revenue.
How do you calculate customer lifetime value step by step?
Take a period, usually a year. Divide revenue by the number of orders to get the average order value. Divide the number of orders by the number of customers to get the purchase frequency. Estimate how many years a customer stays active. Multiply the three figures, then apply your gross margin if you want a profit-based value.
What is the difference between CLV and LTV?
In e-commerce the two abbreviations are used for the same idea: the value a customer brings over the whole relationship. CLV stands for customer lifetime value and LTV for lifetime value. What changes the result is the definition behind the figure: revenue or margin, historical or predicted, per customer or per cohort.
Where do I find customer lifetime value in Shopify?
Shopify's reports don't use that name. The closest metric in its documentation is Amount spent per customer, in the Customer cohort analysis report, defined as the average cumulative amount customers in a cohort have spent at your store. Go to Analytics, then Reports, and filter the Category on Customers to open it.
Should customer lifetime value be calculated on revenue or profit?
Both exist, and they answer different questions. A revenue-based value shows how much customers spend. A margin-based value shows what is left to pay for acquisition, operations and profit. If you compare the figure with what a customer costs to acquire, use the margin-based version, since acquisition is paid out of margin and not out of revenue.

Nicolas helps e-commerce brands grow revenue with WhatsApp marketing. With deep expertise in Shopify ecosystems and conversational commerce, he shares proven strategies for abandoned cart recovery, broadcast campaigns, and AI-powered customer engagement.
Ready to boost your WhatsApp sales?
 Install with Shopify
Suggested articles
Ecommerce Conversion Rate: Formula, Calculation and Shopify
Ecommerce conversion rate explained: the formula, a worked example, the variants, how Shopify calculates it and where to find it, common mistakes and levers.
WhatsApp Marketing for Subscription Boxes: Retention Playbook
WhatsApp playbook for subscription box Shopify brands: 10 templates, churn intercept, tier upgrades, the Recharge integration, and what to measure.

WhatsApp Post-Purchase Playbook: 8 Flows for Repeat Customers
8 WhatsApp post-purchase flows that turn buyers into loyal customers: confirmation, shipping, delivery, review, cross-sell, win-back. With templates.

Yotpo Pricing in 2026: Reviews Plans and Order Tiers
Yotpo pricing explained: free plan limits, Starter and Pro prices by monthly orders, Reviews Booster overage, annual billing, Loyalty and bundle prices.