Click-to-WhatsApp Ads Benchmarks 2026: How to Build Your Own

Summarize this article with an AI
 ChatGPT
 Claude
How to benchmark Click-to-WhatsApp Ads in 2026: the 4 metrics that matter, how to compute them, what changes by region and placement, and the cost stack.
Table of contents (20)
Key takeaways
- No independent public benchmark exists for Click-to-WhatsApp Ads, so rank each new campaign against the quartiles of your own past campaigns.
- The four metrics to track are CPM, CTR, cost per WhatsApp conversation opened and 30-day attributed revenue per opt-in.
- The true cost per opt-in adds Meta message fees and your platform fee to the ad spend that Ads Manager reports.
- Split ad sets by country and break results down by placement, because a blended CPM hides where conversations actually come from.
There is no independent public benchmark for Click-to-WhatsApp Ads by industry, region or placement. The ranges that circulate come from vendors and agencies, mix very different accounts, and are not audited. Instead of another table of numbers you cannot check, this guide shows which metrics to track (CPM, CTR, cost per conversation, revenue per opt-in), how to compute them, what makes them vary by industry, region, placement and creative format, and how to build a benchmark from your own campaigns. If you are setting up your first CTWA campaign, start with our Click-to-WhatsApp Ads how-to guide and come back here to set up your measurement.
Why CTWA Benchmarks Belong in Their Own Bucket
Click-to-WhatsApp Ads share a budget line with Facebook and Instagram website-conversion campaigns, but they should never share a benchmark. Three reasons.
First, the conversion event is different. A CTWA click opens a WhatsApp thread, not a checkout. The optimization target Meta uses (a conversation opened) sits earlier in the funnel than a website conversion, which inflates raw conversion rate relative to a website-conversion campaign aiming at purchase.
Second, the attribution window stretches further. A WhatsApp opt-in can keep generating revenue long after the original ad click, via broadcasts, abandoned-cart flows, and reactivation campaigns, and a 7-day click attribution window misses everything that happens after day 7. Any benchmark you compare against should report 30 to 90 day attributed revenue per opt-in, not single-session ROAS.
Third, the cost stack is different. A CTWA opt-in carries ongoing Meta message fees on top of the ad cost: every marketing or utility template you send that contact afterwards is charged per delivered message, and since October 1, 2026, service replies are charged too, beyond 1,000 free per business phone number each month. Comparing CTWA CPA to Facebook website-conversion CPA without that overhead understates the true cost.
For a primer on why CTWA exists as a separate format, see our Click-to-WhatsApp Ads guide. For the WhatsApp infrastructure side, see the WhatsApp Business API guide and the WhatsApp Business pricing guide.
The 4 Metrics That Actually Matter
Reporting CTWA performance with 12 metrics is a way to hide. The four numbers that decide whether the campaign is healthy are:
- CPM: the cost to reach 1,000 impressions. Compare it only with other CTWA campaigns: Meta optimizes CTWA for an in-platform event, so its CPM does not compare directly with a website-conversion campaign's.
- CTR (link click rate): the share of impressions that turn into a tap on the ad. CTWA CTR is read on the same base as any link-click campaign.
- Cost per WhatsApp conversation opened: how much you pay for a user to land in your WhatsApp thread. This is the cleanest top-of-funnel KPI for CTWA.
- 30-day attributed revenue per opt-in: how much revenue you eventually attribute to that conversation, across broadcast and recovery flows. This is the only KPI that turns CTWA into a P&L line.
Everything else (frequency, hook rate, video VTR) is a creative diagnostic, not a campaign verdict. Look at it when one of the four core numbers breaks.
How to Build Your Own CTWA Benchmark
Your own campaigns are the only benchmark you can fully trust, because you know exactly how each number was measured. Compute these six numbers per campaign and per ad set:
| Metric | How to compute it | Where the data lives |
|---|---|---|
| CPM | Ad spend ÷ impressions × 1,000 | Meta Ads Manager |
| CTR | Link clicks ÷ impressions | Meta Ads Manager |
| Cost per conversation | Ad spend ÷ conversations started | Meta Ads Manager |
| Click to opt-in rate | Opt-ins ÷ link clicks | Ads Manager and your WhatsApp platform |
| 30-day CVR (opt-in to order) | Orders from opt-ins within 30 days ÷ opt-ins | Shopify and your WhatsApp platform |
| 30-day revenue per opt-in | Revenue from opt-ins within 30 days ÷ opt-ins | Shopify and your WhatsApp platform |
Once you have a few months of campaigns, rank them on each metric and use your own quartiles as the benchmark: a new campaign in your bottom quartile needs a fix, one in your top quartile shows you what to scale. When a campaign lands in your bottom quartile, check the creative first and the audience second. For opt-in to order CVR, work on the welcome flow: build it like an actual conversation, not a 12-message hard sell.
What Changes by Industry
Vertical mostly changes the length of the buying cycle and the order value. A repeat-purchase product and a high-ticket or B2B offer do not convert on the same timeline, so set the revenue window per vertical (30 days for fast-moving categories, longer for considered purchases) before you compare campaigns. Within your own vertical, creative quality and welcome-flow design are the levers you control. For vertical playbooks, see WhatsApp marketing for beauty brands, WhatsApp marketing for fashion DTC brands, WhatsApp marketing for food and beverage brands, subscription boxes, and drive-to-store campaigns for retail footprints.
What Changes by Region
Region changes both sides of the equation: the price of the auction (CPM), and how natural it is for your audience to start a WhatsApp conversation, which depends on how widely people use WhatsApp in that country. A result blended across countries hides both effects.
Two practical rules. Split ad sets by country, so one expensive market does not hide a cheap one, and compare each country with its own history. And if CTWA economics look poor in one market, test another audience or another language before writing off the format.
What Changes by Placement
Each placement (Reels, Feed, Stories, Instagram Explore, Facebook Marketplace) has its own inventory and its own auction prices, so a CPM averaged over all placements hides where your conversations actually come from. Break results down by placement in Ads Manager before you judge a campaign.
A practical setup: build a Reels-only ad set and a Feed and Stories ad set in parallel, then compare cost per conversation and 30-day revenue per opt-in between them before you move budget. Do not cut a placement before you have measured it: you may need that inventory to scale.
What Changes by Creative Format
The creative format that works depends on the placement. Reels is a full-screen vertical placement, so it calls for vertical video, while Feed also takes static images and carousels.
| Format | Main placement | What to test |
|---|---|---|
| Single static image | Feed and Stories | A clear offer and a visible WhatsApp cue |
| Carousel (3 to 5 cards) | Feed | Catalog-style hooks, one product per card |
| Vertical video (Reels native) | Reels and Stories | A spoken hook and an on-screen chat in the first seconds |
| Square video adapted to Reels | Feed (it does not fill a vertical screen) | A native vertical cut of the same video before you scale it on Reels |
| User-generated content (UGC) | Reels, Stories and Feed | Real customers asking or answering questions |
Test formats inside the same ad set and let cost per conversation and 30-day revenue per opt-in pick the winner for your account, placement by placement.
The Real Cost Stack of CTWA
A CTWA opt-in does not cost only the ad spend. Three layers stack up.
Layer 1: Ad cost. What Meta charges for impressions. This is the headline CPM, and the only layer Ads Manager reports.
Layer 2: Meta message fees. Meta charges per delivered message, not per conversation. A conversation started from a CTWA ad opens a free entry point window: if you reply inside the 24-hour customer service window, your messages are not charged while that window is open, which may be for up to 7 days according to Meta's pricing documentation read on October 8, 2026 (Meta Business Agent messages excluded). After that, each template you send is charged at its category rate for the recipient's country: $0.0250 for a US marketing message and $0.0034 for a US utility message (Meta's pricing). Replies inside the 24-hour customer service window were not charged until September 30, 2026. Since October 1, 2026, they cost the utility rate after 1,000 free service messages per business phone number each month. See the WhatsApp Business pricing guide for rates by country.
Layer 3: Platform cost. Your WhatsApp Business platform fee (the Business Solution Provider) and any team time. On Kanal, this is a monthly plan from $89/month (unlimited automations from the Scale plan), and WhatsApp fees are passed through at cost, with no per-message markup.
Total cost per opt-in is the sum of the three layers: the ad cost per opt-in, the Meta fees on the messages you send that contact over its lifetime, and the platform cost amortized per opt-in. Put your own numbers in each layer: the pricing guide lists Meta's rates by country, and Kanal's pricing page has a cost simulator that shows the total, WhatsApp fees included. A benchmark that only counts Layer 1 makes CTWA look cheaper than it is.
How to Read Your Numbers at Your Stage
Benchmarks lie when they are read flat. Three filters matter.
Filter 1: account maturity. A new Meta ad account with no purchase signal gives the delivery system little to optimize on, so compare your CPMs with your own account's history rather than with an established advertiser's. If your CPMs look high, check pixel maturity before blaming the platform.
Filter 2: country mix. A blended CPM hides the truth. Split your ad set by country if you target multiple geos. A 6 euro CPM averaged over France and Switzerland is not the same as 6 euros in France alone.
Filter 3: welcome flow quality. Opt-in to order CVR depends on what happens after the click, not only on the ad. A clean 3-message welcome flow with a clear value drop gives the new contact a reason to stay, where a 10-message hard sell invites an opt-out. See the welcome-flow section of our CTWA how-to guide.
If a campaign sits in the bottom quartile of your own campaigns on cost per conversation, fix the creative first (it is the cheapest lever). If it sits in the bottom quartile on opt-in to order CVR, fix the welcome flow first.
5 Concrete Moves to Lift CTR
When CTR drops, raising the budget will not fix it. Pull these levers first.
- Add a visible WhatsApp icon overlay in the creative. The user knows the tap opens a WhatsApp chat, not a website.
- Switch from website-style hooks (Shop Now) to conversation hooks (Chat with us, Ask us, Send a DM). A conversation hook tells people what happens after the tap; test it against your current hook in the same ad set.
- Frame the offer as a single message conversation, not a website visit. Example: instead of Get 20% off, run Reply HEY for your 20% code.
- Use the first 1.5 seconds of any video to show a phone screen with a WhatsApp chat appearing. It shows, before any text is read, that the ad leads to a chat.
- Run 3 to 5 creative variants per week in the same ad set, and cut the weakest 2 at day 4. Iteration speed is what surfaces the creatives worth scaling.
For the broader creative system around these tactics, see our CTWA guide and the WhatsApp campaigns page.
How Kanal Tracks CTWA Performance End-to-End
Meta Ads Manager reports what happens up to the conversation; what happens after the WhatsApp click (orders, repeat purchases) lives in your WhatsApp platform and your store. Kanal closes the loop in three ways.
First, every CTWA ad gets a unique entry-point reference tag so the dashboard knows which campaign brought each opt-in. You see CPM, CTR, cost per conversation, and 30-day revenue per opt-in by campaign and ad set, side by side.
Second, Kanal pushes WhatsApp Lead and Purchase events back to the Meta pixel via the Conversions API. Meta then optimizes future ad delivery toward opt-ins that actually become customers, not just opt-ins that exist.
Third, the merchant dashboard breaks down revenue by post-click flow (welcome, broadcast 1, broadcast 2, recovery) so you can attribute the long tail of CTWA revenue to its source campaign. See it live on the WhatsApp campaigns page, or book a demo and we will walk through it on your data.
Where to Go Next
Once your own baseline is in place, test creative iteration before bid changes. Build a vertical Reels native ad with a clear chat cue and a single-message hook, and pair it with a 3-message welcome flow. Measure 30-day attributed revenue per opt-in, not single-session CVR. If you need help wiring the attribution side, check pricing or book a demo.
FAQ
What is a good CTR for Click-to-WhatsApp Ads in 2026?
There is no independent public benchmark for Click-to-WhatsApp Ads CTR. A good CTR is one that beats your own previous campaigns in the same country and placement; when it drops, check the creative first.
What is the average cost per WhatsApp conversation in 2026?
There is no independent public average. Cost per conversation is your ad spend divided by the conversations started, so it moves with the CPM of the country you target: read it per country and compare it with your own history.
What CVR should I expect from a Click-to-WhatsApp Ad to a paid order?
There is no reliable public figure to expect. Measure it over a 30 day window (orders from opt-ins divided by opt-ins), and longer for B2B and high-ticket offers.
Are CTWA benchmarks the same as Lead Ads benchmarks?
No. Lead Ads optimize for form submissions, CTWA optimize for WhatsApp conversations opened, so their cost per lead is not measured on the same event. Compare them on the cost per acquired contact who later buys.
Why do CTWA CPMs differ between countries?
CPM is set by the auction in each market: how many advertisers compete for the same audience, and how much they bid for it. Split your ad sets by country and compare each one with its own history.
How does Reels placement affect CTWA cost?
There is no independent public figure for the CPM gap between Reels and Feed on CTWA campaigns. Run a Reels-only ad set next to a Feed and Stories ad set and compare cost per conversation and 30-day revenue per opt-in.
What CTWA benchmark should I trust if I sell on Shopify?
Trust your own 30-day backfilled data over published benchmarks. Pull cost per opt-in, CTR, and 30-day attributed revenue per opt-in, then rank each new campaign against your own past campaigns.
See Kanal on your own store
- Your campaigns and cart reminders on WhatsApp, starting from your own store
- Post-purchase offers, back-in-stock alerts, then the AI agent that advises your customers
- You leave with the plan that fits and its price

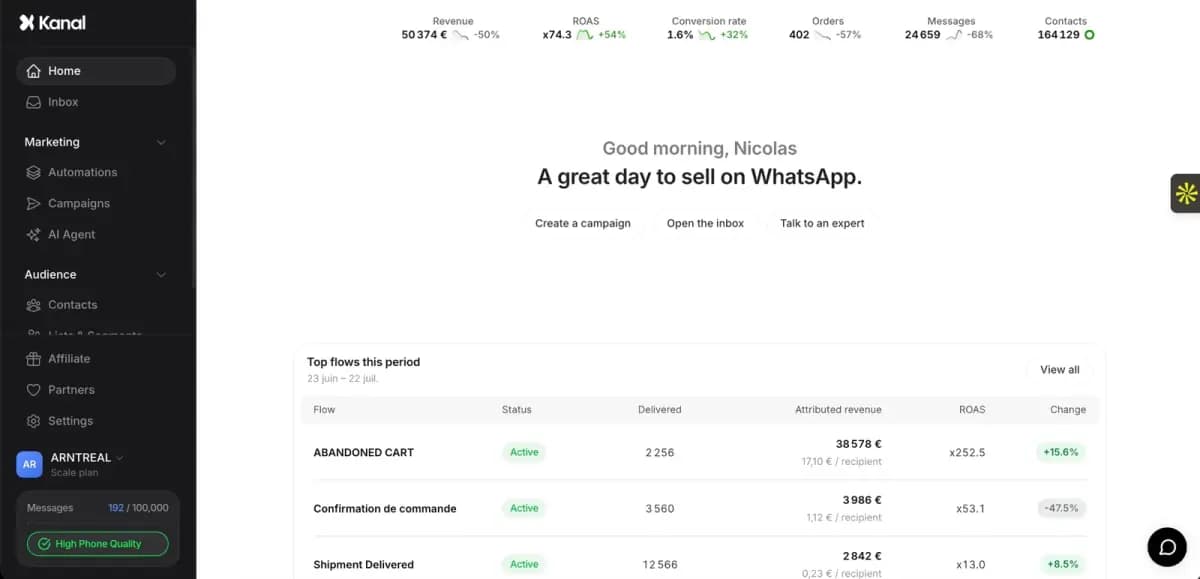
- brands
- 500+
- to set up
- 5 min
- open rate on WhatsApp
- +90%
5/5 on the Shopify App Store (125 reviews)

Nicolas helps e-commerce brands grow revenue with WhatsApp marketing. With deep expertise in Shopify ecosystems and conversational commerce, he shares proven strategies for abandoned cart recovery, broadcast campaigns, and AI-powered customer engagement.
Glossary terms in this article
Quick definitions for the WhatsApp Business terms used above.
Click-to-WhatsApp Ads
Click-to-WhatsApp ads are Facebook and Instagram ads whose button opens a WhatsApp chat with the business instead of a website. The shopper sends the first message, which lets the business reply freely and, under Meta's pricing, for free during a limited window.
Read full definitionOpt-in
A WhatsApp opt-in is the permission a person gives a business to send them messages on WhatsApp. WhatsApp's Business Messaging Policy requires it before any message: the business must have the person's phone number and their agreement to hear from that business.
Read full definitionUtility Template
A utility template is a WhatsApp message template that follows up on something the customer did or asked for: an order confirmation, a shipping update, a payment receipt. It must not contain promotional content, otherwise Meta re-categorizes it as marketing.
Read full definitionCustomer Service Window (24-hour window)
The customer service window is a 24-hour timer that starts when a WhatsApp user messages or calls a business. While it is open, the business can reply with free-form messages; once it closes, it can only send approved message templates.
Read full definitionWhatsApp Business Platform
The WhatsApp Business Platform is the set of APIs Meta offers businesses to message customers on WhatsApp at scale: the Cloud API, the Business Management API and the Marketing Messages API. It is separate from the WhatsApp Business app, which runs on a phone.
Read full definitionOpt-out
A WhatsApp opt-out is a person's request to stop receiving messages from a business on WhatsApp. WhatsApp's Business Messaging Policy requires businesses to respect every such request, whether it is made on WhatsApp or elsewhere.
Read full definitionSuggested articles
Click to WhatsApp Ads (CTWA): Paid Acquisition Guide 2026
Master Click to WhatsApp Ads for Shopify in 2026: setup, budget, audiences, creative best practices, Meta pixel sync and how to scale your spend.

WhatsApp Marketing ROI: 12 KPIs, Formulas and Attribution
The 12 WhatsApp marketing KPIs every Shopify brand should track: formulas for CTR, ROAS, CAC and CLV, attribution windows and building your own benchmark.
Shopify Instagram Integration: Connect Your Store (2026)
How to connect Shopify to Instagram with the Facebook & Instagram sales channel: requirements, steps, catalog sync, common errors and product tags.
ManyChat for Instagram: How It Works, Setup and Rules
How ManyChat automates Instagram: connecting a professional account, the comment, story reply and DM keyword triggers, and the Meta rules that apply.