WhatsApp Marketing ROI: 12 KPIs and Industry Benchmarks (2026)

The 12 WhatsApp marketing KPIs every Shopify brand should track in 2026. Open rates, CTR, ROAS, attribution, LTV, and benchmarks by vertical. Free ROAS calculator inside.
Table of contents (33)
WhatsApp marketing produces some of the highest absolute revenue per recipient of any channel in e-commerce, but only if you measure it correctly. Vanity metrics like open rate (always 90 percent plus) hide the real signal, and most Shopify brands either over-celebrate trivial wins or under-invest because they cannot prove the ROI to their finance team.
This guide is the operating manual for measuring WhatsApp marketing in 2026. Twelve KPIs every Shopify brand should track, the formulas behind each, benchmarks by vertical, and the attribution setup that holds up under scrutiny. Plug your own numbers into our ROAS break-even calculator at any point to see where your store actually lands.
Why Most WhatsApp KPI Tracking Is Broken
Three patterns make WhatsApp KPI tracking unreliable in most stores:
- Open rate is reported as a hero metric. WhatsApp open rates sit between 93 and 98 percent across every vertical and every list quality. Reporting them is like reporting that water is wet, they tell you nothing about performance.
- Revenue attribution stops at the click. GA4 sees the click but loses the buyer if they switch devices or take longer than a session to convert. WhatsApp drives long-tail conversions that last-click misses entirely.
- Cost accounting ignores Meta conversation fees and team time. A 99 euro Kanal subscription looks cheap until you add 400 euros of Meta conversation fees and 5 hours a week of team time. The real cost is roughly 3x the platform fee.
Fix these three and your ROI numbers become real. Without the fix, the channel either looks unfairly amazing or unfairly weak.
The 12 KPIs Every Shopify Brand Should Track
1. Open Rate
The baseline that tells you your list is alive. WhatsApp benchmarks sit at 93 to 98 percent, anything below 90 percent suggests deliverability problems (likely from sending to inactive numbers, or breaching Meta quality rating thresholds).
| Channel | Average Open Rate |
|---|---|
| 96% | |
| SMS | 98% |
| 21% | |
| Push notification | 5-8% |
| RCS | 75-85% |
Useful as a hygiene check, not as a performance KPI. For the full landscape see WhatsApp marketing statistics 2026.
2. Click-Through Rate (CTR)
CTR is the first KPI that actually discriminates between good and bad templates. The benchmark is 15 to 25 percent, with beauty and fashion at the top, electronics at the bottom.
| Vertical | WhatsApp CTR | Email CTR |
|---|---|---|
| Fashion & accessories | 18-28% | 2.5% |
| Beauty & cosmetics | 20-30% | 3.1% |
| Food & beverage | 15-22% | 2.0% |
| Home & decor | 14-20% | 2.3% |
| Electronics | 12-18% | 1.8% |
| Sports & outdoor | 16-24% | 2.7% |
Levers that move CTR: personalization (first name, last viewed product), a single clear CTA button, segmented sends, and A/B-tested visuals. See WhatsApp marketing examples brands for tested template formats.
3. Conversion Rate
The percentage of recipients who buy after receiving the message. The most direct line to revenue.
| Message Type | Conversion Rate |
|---|---|
| Abandoned cart recovery | 15-30% (of recovered carts) |
| Promotional campaign | 3-8% |
| Back-in-stock notification | 10-20% |
| Post-purchase upsell | 5-12% |
| Flash sale / urgency | 8-15% |
Abandoned cart recovery is the highest-converting flow by a wide margin. Our WhatsApp abandoned cart recovery templates guide breaks down 15 templates with conversion data per format.
4. ROAS (Return on Ad Spend)
The KPI your CFO actually wants to see.
ROAS = WhatsApp-attributed revenue ÷ Total WhatsApp costTotal cost includes the Kanal subscription plus Meta conversation fees plus team time. Skipping any of these inflates the number and damages your credibility internally.
| Channel | Average ROAS |
|---|---|
| WhatsApp marketing | 5-12x |
| Email marketing | 2-4x (but 30-40x by Klaviyo accounting) |
| SMS marketing | 3-5x |
| Facebook / Instagram ads | 2-4x |
| Google ads (search) | 2-8x |
The Klaviyo email ROI number (often quoted at 36-42x) uses near-zero send cost as the denominator, which is mathematically correct but misleading when comparing total revenue per contact. WhatsApp produces 2 to 4 times the absolute revenue per recipient. Run both, optimize each for what it does best.
5. Customer Acquisition Cost (CAC)
How much you spend to acquire a new customer via WhatsApp.
CAC WhatsApp = Total WhatsApp cost ÷ New customers acquired through WhatsAppBenchmark: 5 to 15 euros per new customer, well below Facebook Ads (15 to 50 euros) and Google Ads (20 to 80 euros), because WhatsApp targets opted-in audiences who already know your brand.
6. Customer Lifetime Value (CLV)
The total revenue a customer generates across their relationship with your brand. WhatsApp pushes CLV up via four mechanisms:
- Abandoned cart recovery that converts more prospects
- Post-purchase upsell that increases AOV
- Loyalty and VIP programs that lift repeat rate
- AI chatbot service that reduces churn
CLV = AOV × Annual purchase frequency × Customer lifespan (years)WhatsApp lifts CLV by 20 to 40 percent on average across measured cohorts. The mechanism is mostly higher repeat rate, not higher AOV.
7. Opt-Out Rate
Critical to monitor. A rising opt-out rate is the leading indicator of list damage.
| Opt-out Rate | Interpretation | Action |
|---|---|---|
| Below 0.5% | Excellent | Continue |
| 0.5 to 1% | Normal | Monitor trend |
| 1 to 2% | Warning | Reduce frequency or tighten segmentation |
| Above 2% | Critical | Stop campaigns and audit strategy |
Opt-outs above 2 percent in a single campaign also damage your Meta quality rating, which can trigger sending limits.
8. Revenue Per Recipient
The single most useful KPI because it collapses open rate, CTR, and conversion into one number.
Revenue per recipient = Campaign revenue ÷ Number of recipientsBenchmarks:
- Abandoned cart recovery: 1.50 to 3.00 euros per recipient
- Broadcast campaign: 0.40 to 1.00 euros per recipient
- Back-in-stock alert: 2.00 to 4.00 euros per recipient
- Post-purchase upsell: 1.00 to 2.50 euros per recipient
If your number is below the floor, the issue is usually template quality or list freshness. For broadcast specifically see our WhatsApp broadcast guide.
9. Reply Rate
WhatsApp is conversational. The reply rate is a leading indicator of brand affinity and an opportunity for chatbot-driven conversion.
Benchmark: 3 to 8 percent on recovery flows, 1 to 3 percent on broadcasts. Higher reply rates correlate with higher conversion when paired with a good AI chatbot that handles objections in real time. The mechanism is described in detail in our conversational commerce guide.
10. Sequence Completion Rate
For multi-message flows (abandoned cart, post-purchase, win-back), the percentage of recipients who receive every step without unsubscribing or converting earlier.
Benchmark: 60 to 75 percent on a three-message cart recovery sequence. Lower numbers mean either too-aggressive frequency or too-similar copy across messages.
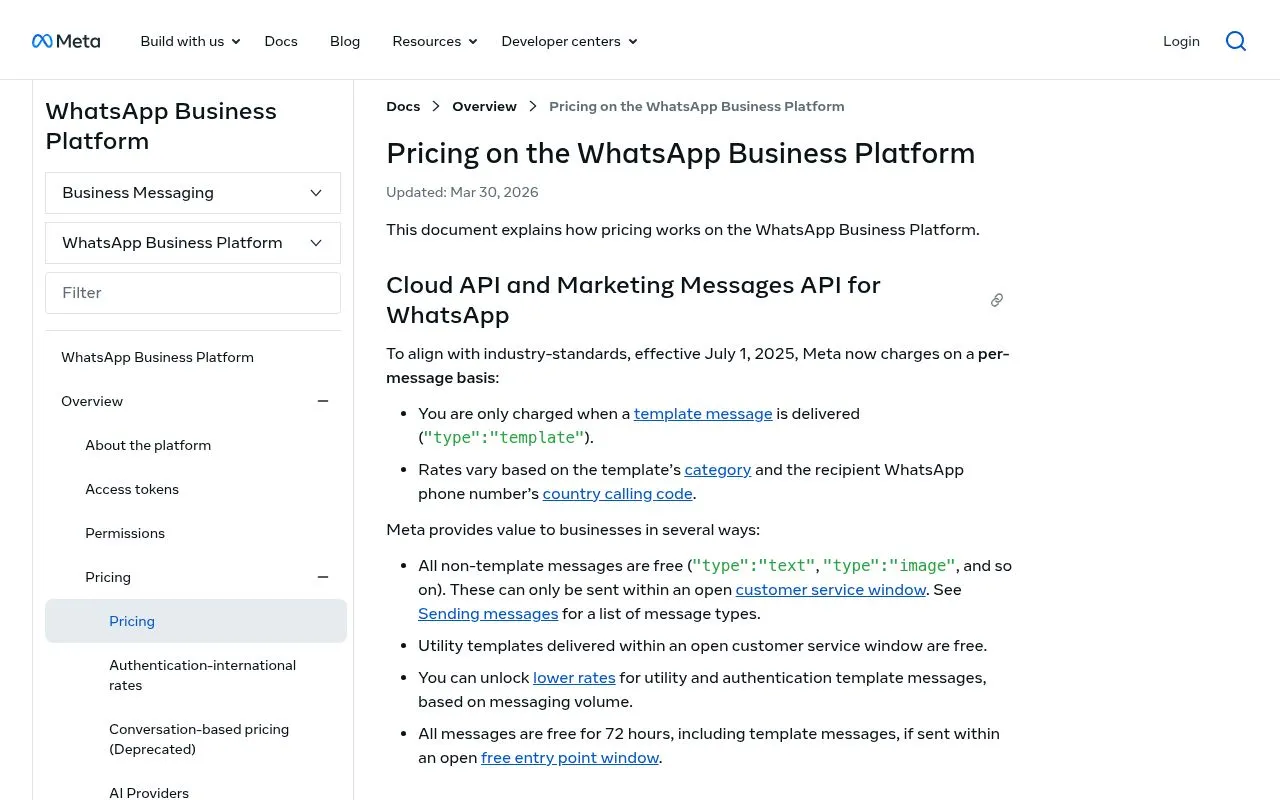
11. Cost Per Conversation
Meta charges per conversation window, not per message. Marketing conversations sit around 0.065 euros in Europe, utility around 0.038 euros, service-initiated around 0.025 euros. The full pricing breakdown is in our WhatsApp business pricing guide.
Track cost per conversation by category, a healthy marketing-heavy account sits at 0.05 to 0.07 euros per conversation; a utility-heavy account (transactional notifications) sits at 0.03 to 0.04 euros.
12. Lift Over Control
The gold-standard measurement. Hold out 10 percent of an opted-in segment and never send to them. Compare conversion rates between the WhatsApp-receiving group and the held-out group.
The delta is your true incremental lift, stripped of cannibalization from email or organic traffic. Most stores discover that 30 to 50 percent of WhatsApp-attributed revenue would have converted anyway through other channels. The remaining 50 to 70 percent is true incremental revenue.
This is the number to report to your CFO. It is also the number that survives scrutiny when finance digs into attribution.
Calculating Total WhatsApp ROI
The complete formula:
ROI = (WhatsApp revenue − WhatsApp cost) ÷ WhatsApp cost × 100Identifying WhatsApp Revenue
Five revenue sources, ranked by typical contribution:
| Source | Share of Total |
|---|---|
| Abandoned cart recovery | 30-45% |
| Marketing campaigns / broadcasts | 20-30% |
| Post-purchase upsell | 10-15% |
| Back-in-stock alerts | 8-12% |
| Chatbot-assisted sales | 5-10% |
Identifying WhatsApp Cost
| Cost Line | Monthly Range |
|---|---|
| Kanal subscription | 49-199 euros (see pricing) |
| Meta marketing conversations | ~0.065 euros each |
| Meta utility conversations | ~0.038 euros each |
| Team time (campaign creation) | 2-5 hours / week |
Worked Example: Fashion Store, 5,000 WhatsApp Contacts
Monthly revenue from WhatsApp:
- Cart recovery: 120 recovered × 75 euros = 9,000 euros
- Campaigns (2 / month): 3,000 messages × 5 percent conversion × 65 euros = 9,750 euros
- Post-purchase upsell: 200 upsells × 35 euros = 7,000 euros
- Total revenue: 25,750 euros
Monthly cost:
- Kanal subscription: 99 euros
- Meta conversations: ~6,000 × 0.06 euros = 360 euros
- Total cost: 459 euros
ROI = (25,750 − 459) ÷ 459 × 100 = 5,509 percent ROAS = 25,750 ÷ 459 = 56x
That's a strong performer, not a typical one. Your number will land based on vertical, catalog, and execution quality. Use the ROAS break-even calculator for your own modeling.
Attribution Models for WhatsApp
Last-Click
Simple, fast, defensible. The conversion is attributed to the last channel before purchase. Best for stores doing under 500 orders a month or just starting WhatsApp.
Multi-Touch
Splits credit across every touchpoint. More accurate, more complex. Useful once your channel mix gets denser (WhatsApp + email + SMS + paid).
Data-Driven
Uses machine learning to assign credit based on observed influence. This is what Kanal's analytics ship by default once you cross 500 orders a month.
Recommended Attribution Windows
| Message Type | Attribution Window |
|---|---|
| Cart recovery | 7 days |
| Promotional campaign | 3 days |
| Back-in-stock alert | 3 days |
| Post-purchase upsell | 7 days |
| Welcome flow | 14 days |
Channel Comparison: WhatsApp vs Email vs SMS
| Metric | SMS | ||
|---|---|---|---|
| Open rate | 96% | 21% | 98% |
| CTR | 15-25% | 2-5% | 6-8% |
| Conversion rate | 3-8% | 1-2% | 1-3% |
| Average ROAS | 5-12x | 2-4x (or 36x by Klaviyo math) | 3-5x |
| Cost per message | 0.065 EUR | 0.001-0.01 EUR | 0.04-0.07 EUR |
| Cost per conversion | 1-3 EUR | 0.5-2 EUR | 2-5 EUR |
| CLV impact | +20 to 40% | +10 to 15% | +5 to 10% |
| Time to set up | 15 min (Kanal) | 30 min | 20 min |
The optimal mix runs all three: WhatsApp for high-touch moments (cart, urgency, support), email for newsletters and longer nurture, SMS as a deliverability fallback. The orchestration layer is usually Klaviyo.
 WhatsApp Business Platform" style="max-width:100%;border-radius:12px" loading="lazy" />
ROAS Benchmarks by Vertical (2026)
| Vertical | WhatsApp ROAS | Conversion Rate | Recovered AOV |
|---|---|---|---|
| Fashion & accessories | 8-15x | 5-10% | 85 EUR |
| Beauty & cosmetics | 10-18x | 6-12% | 55 EUR |
| Food & beverage | 5-8x | 4-7% | 45 EUR |
| Home & decor | 6-10x | 3-6% | 120 EUR |
| Electronics | 4-7x | 2-5% | 200 EUR |
| Sports & outdoor | 7-12x | 5-8% | 95 EUR |
| Baby & kids | 8-14x | 5-9% | 70 EUR |
Source: aggregated Kanal merchant data, Q1 2026.
Tools for Measuring WhatsApp ROI
Kanal Analytics
The Kanal dashboard is the source of truth for WhatsApp KPIs:
- Revenue attributed by flow (cart, campaign, upsell, back-in-stock)
- Open rate, CTR, and conversion by campaign
- ROI and ROAS calculated in real time
- Performance segmented by audience
- Cross-channel comparison against email and SMS
Klaviyo
The Klaviyo + Kanal integration brings:
- WhatsApp metrics inside the Klaviyo dashboard
- Side-by-side WhatsApp and email flow comparison
- Multi-channel revenue attribution
- Engagement-based segmentation across channels
Google Analytics / GA4
UTM-tag every WhatsApp link to track conversions in GA4:
https://yourstore.com/product?utm_source=whatsapp&utm_medium=message&utm_campaign=cart_recoveryFor Google's own implementation guidance see the GA4 UTM documentation.
Kanal ROAS Calculator
Our ROAS break-even calculator estimates your return based on contact volume, AOV, and expected conversion rates. Useful before installation as a sanity check.
Mistakes That Tank WhatsApp ROI
- Sending too many messages. More than 4 to 6 marketing messages a month tanks opt-outs. Quality over quantity.
- Skipping segmentation. Blasting your full list with the same message is the fastest path to a damaged sender reputation.
- Ignoring automation. Automated flows (cart, post-purchase, back-in-stock) produce 60 to 70 percent of WhatsApp revenue. Skip them and you're leaving money in plain sight.
- Chasing the wrong KPI. Open rate is meaningless on WhatsApp. Focus on revenue per recipient and ROAS.
- Ignoring compliance. GDPR and Meta's policies impose real constraints. See our opt-in compliance guide. Non-compliance can mean both regulatory fines and a banned WhatsApp Business account.
Building Your WhatsApp KPI Dashboard
Reporting cadence:
| Cadence | KPIs |
|---|---|
| Daily | Messages sent, open rate, CTR, opt-outs |
| Weekly | Conversion rate, revenue per flow, recovered carts |
| Monthly | ROAS, ROI, CAC, CLV, total WhatsApp revenue, channel comparison |
| Quarterly | Trend lines, vertical benchmarks, strategic recalibration |
Resources
- ROAS break-even calculator, model your numbers in under 2 minutes
- Kanal pricing, see which plan matches your volume
- Book a demo, 20-minute walkthrough of the analytics dashboard
- Kanal on Shopify, install and start measuring
- WhatsApp Shopify integration, the technical setup
- AI chatbot, capture the reply-rate revenue you're currently missing
- Klaviyo email benchmarks, for direct comparison
- GA4 UTM documentation
- Meta WhatsApp Business Platform pricing
Related reading: WhatsApp abandoned cart recovery templates | WhatsApp marketing statistics 2026 | WhatsApp broadcast guide | Conversational commerce guide | WhatsApp business pricing guide
Frequently asked questions
What is a healthy WhatsApp marketing ROAS?
A healthy ROAS for WhatsApp marketing sits between 5x and 12x for e-commerce brands using segmentation and automation. Top performers in beauty and fashion regularly cross 15x. Anything below 3x suggests you are paying for conversations that do not convert, usually because your list is unsegmented or your templates lack a clear CTA. ROAS is calculated as WhatsApp-attributed revenue divided by total WhatsApp cost (subscription plus Meta conversation fees plus team time).
What is the ROAS benchmark by industry?
Beauty and cosmetics top the table at 10 to 18x. Fashion sits at 8 to 15x, baby and kids at 8 to 14x, sports at 7 to 12x, home decor at 6 to 10x, food and beverage at 5 to 8x, and electronics at 4 to 7x. The spread inside each vertical is driven mostly by list quality and automation coverage rather than vertical economics. A poorly run beauty brand will underperform a tightly run electronics brand.
How do I track WhatsApp revenue accurately?
Use UTM parameters on every WhatsApp link (utm_source=whatsapp, utm_medium=message, utm_campaign=campaign_name) so revenue lands in GA4 with proper attribution. Inside Kanal, every message link is auto-tagged so the dashboard shows revenue per flow, per template, and per campaign. For multi-touch attribution, connect Klaviyo to see WhatsApp sitting alongside email and SMS in a unified revenue report. Last-click is fine to start; move to data-driven attribution once your volume hits 500+ orders a month.
How does WhatsApp ROI compare to Klaviyo email benchmarks?
Klaviyo benchmarks put email ROI at 36 to 42 dollars per dollar spent due to near-zero send cost, but absolute revenue per recipient is far lower than WhatsApp. WhatsApp produces 2 to 4 times the absolute revenue per contact, with a percentage ROAS in the 5 to 12x range. The right comparison is total revenue, not ROAS, WhatsApp wins on volume while email wins on cost efficiency. Most top brands run both, with WhatsApp owning recovery and urgency moments and email owning newsletters and nurture.
What is the most important KPI to track?
Revenue per recipient is the single most useful KPI because it collapses open rate, CTR, and conversion into one number that represents real money. Aim for 1.50 to 3.00 euros per recipient on recovery and abandoned cart flows, and 0.40 to 1.00 euros on broadcast campaigns. Open rate is almost meaningless on WhatsApp (always 90 percent plus), and CTR alone does not capture downstream conversion quality.
Nicolas helps e-commerce brands grow revenue with WhatsApp marketing. With deep expertise in Shopify ecosystems and conversational commerce, he shares proven strategies for abandoned cart recovery, broadcast campaigns, and AI-powered customer engagement.
Ready to boost your WhatsApp sales?
Glossary terms in this article
Quick definitions for the WhatsApp Business terms used above.
Quality Rating
The quality rating is a score WhatsApp assigns to a business phone number based on recent customer feedback, mainly blocks and reports. It influences messaging limits.
Read full definitionAbandoned Cart Recovery
Abandoned cart recovery is the practice of messaging shoppers who added items to their cart but left without buying, to encourage them to complete the purchase.
Read full definitionBroadcast
A broadcast is a message sent to many WhatsApp contacts at once, typically a marketing campaign delivered to a segment of opted-in customers.
Read full definitionWhatsApp Flows
WhatsApp Flows is a feature for building structured, multi-step experiences inside a chat, such as forms, surveys, bookings, and guided product selection.
Read full definitionWhatsApp Business Platform
The WhatsApp Business Platform is the umbrella name for the set of products and APIs that Meta offers businesses to message customers programmatically at scale.
Read full definitionSuggested articles

WhatsApp Marketing Statistics 2026: 60+ Data Points You Need to Know
60 hand-picked WhatsApp marketing statistics for 2026: open rates, ROI, conversion data, user behavior, market size, and benchmarks by industry. Sources cited.
Best WhatsApp Marketing Software for Shopify (2026)
The best WhatsApp marketing software for Shopify stores in 2026, compared by fit: Kanal, Wati, Charles, Zoko, Interakt, and Trengo. See which WhatsApp platform matches your store, budget, and goals.

WhatsApp Marketing for Subscription Boxes: Reduce Churn 20% (2026)
WhatsApp playbook for subscription box Shopify brands: 10 templates, churn intercept, tier upgrades, Recharge and Bold integration. Cut churn 20%.

WhatsApp Marketing for Jewelry Brands: Templates & ROI (2026)
WhatsApp playbook for jewelry brands on Shopify: 10 high AOV templates, VIP flows, gift season campaigns, made to order workflows, 2026 ROI benchmarks.